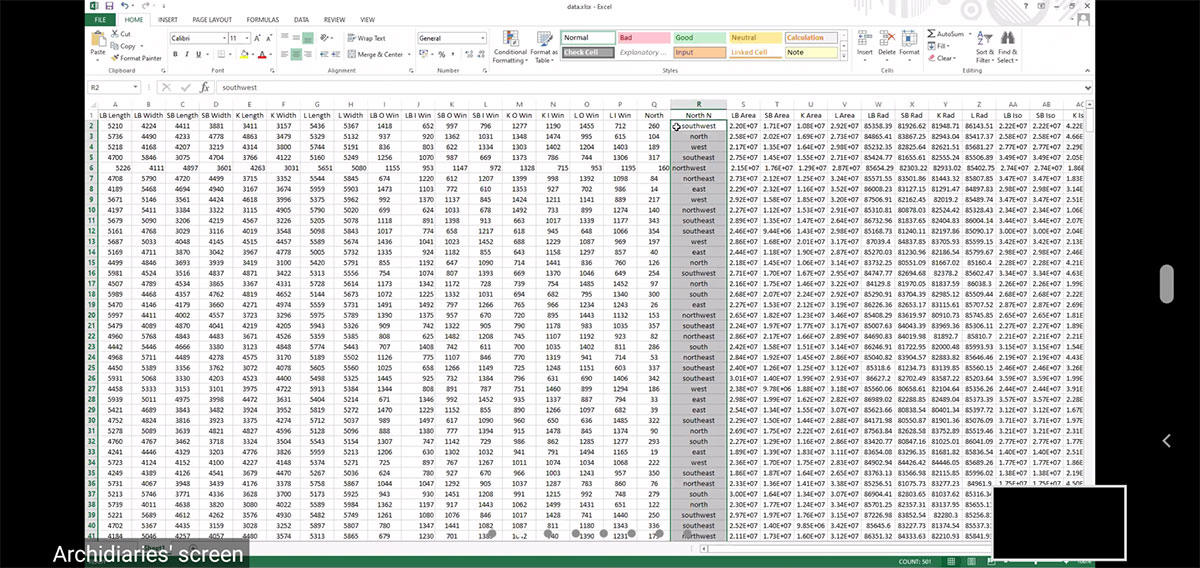
Software used: Python 2.7, Jupyter Notebook, Seaborn, Pandas, MS Excel.
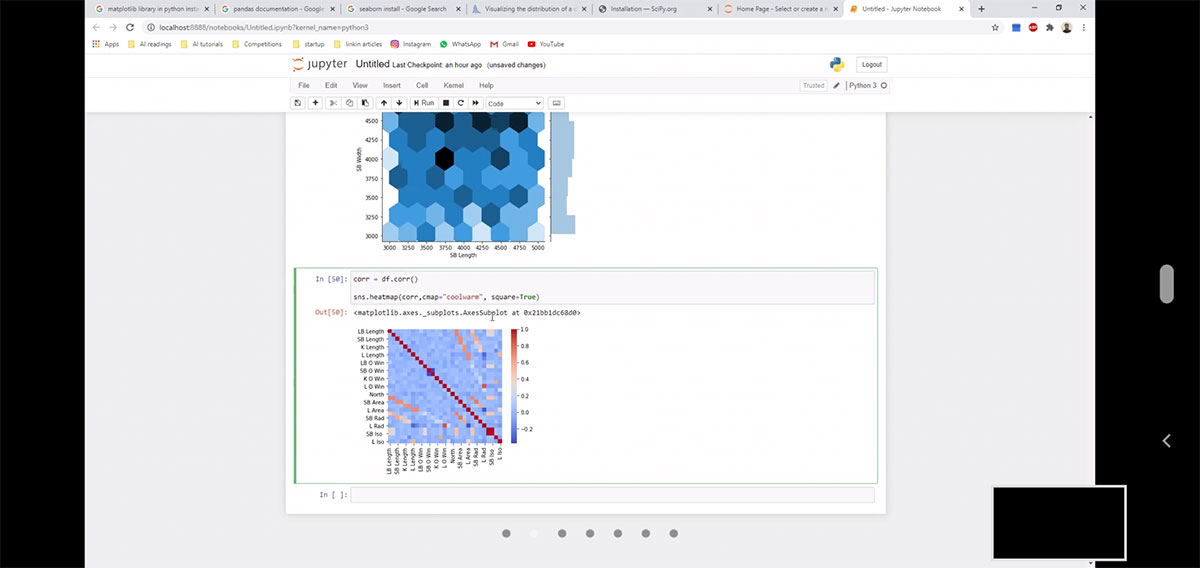
Tools Used: Python 2.7, Jupyter Notebook, Seaborn
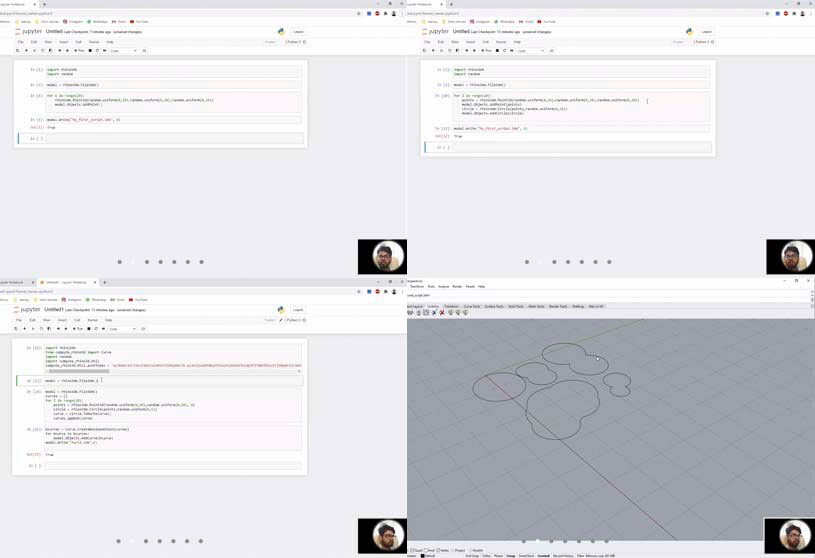
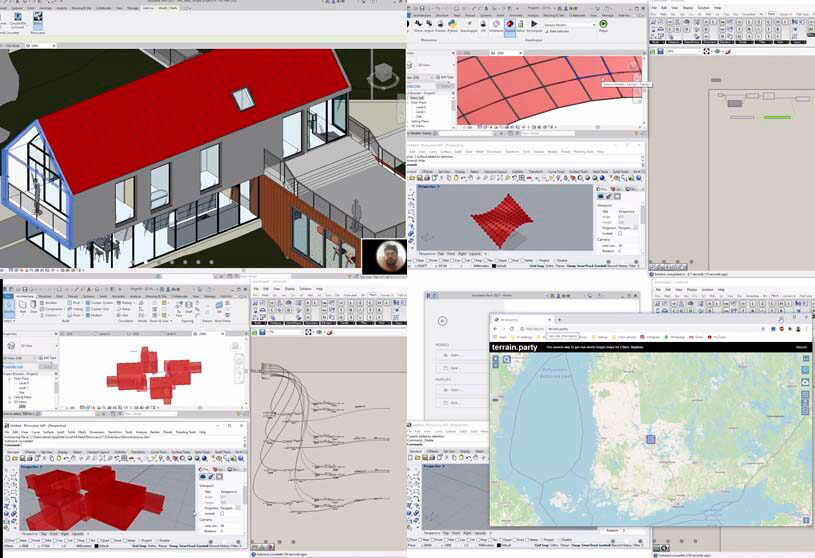
The session was to learn scripting in python to generate the visual graphs of the data generated from the fitness criteria for the design generated in grasshopper. For this, the data collected was from the project created in initial session of this workshop in which four rooms were generated around a courtyard. This data was conditioned through scripting in jupyter notebook. Finally, through Seaborn library the graphs of the same data were generated in jupyter notebook.
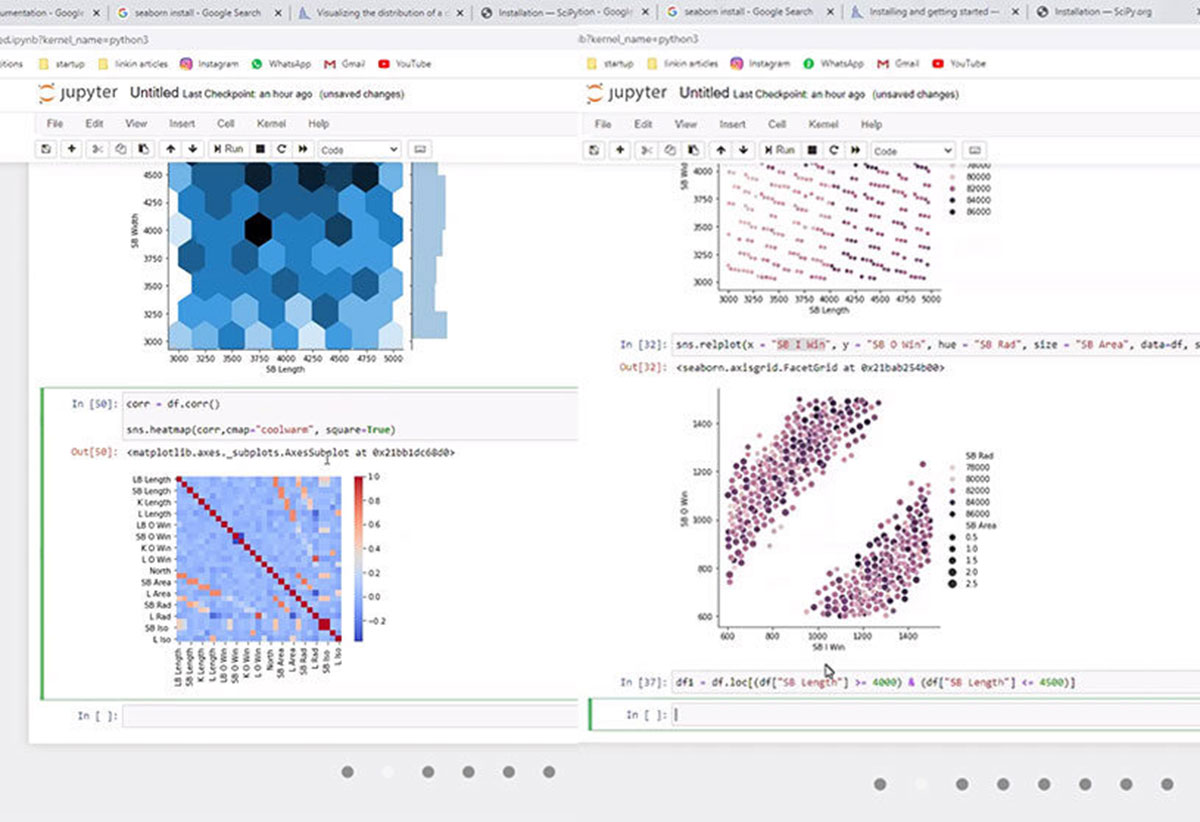
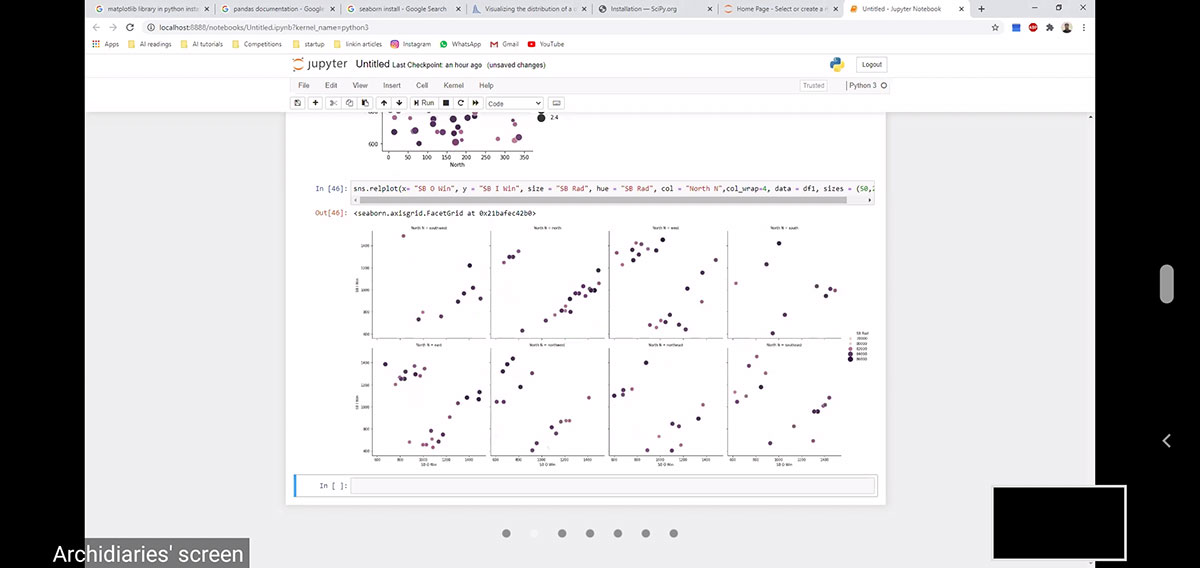
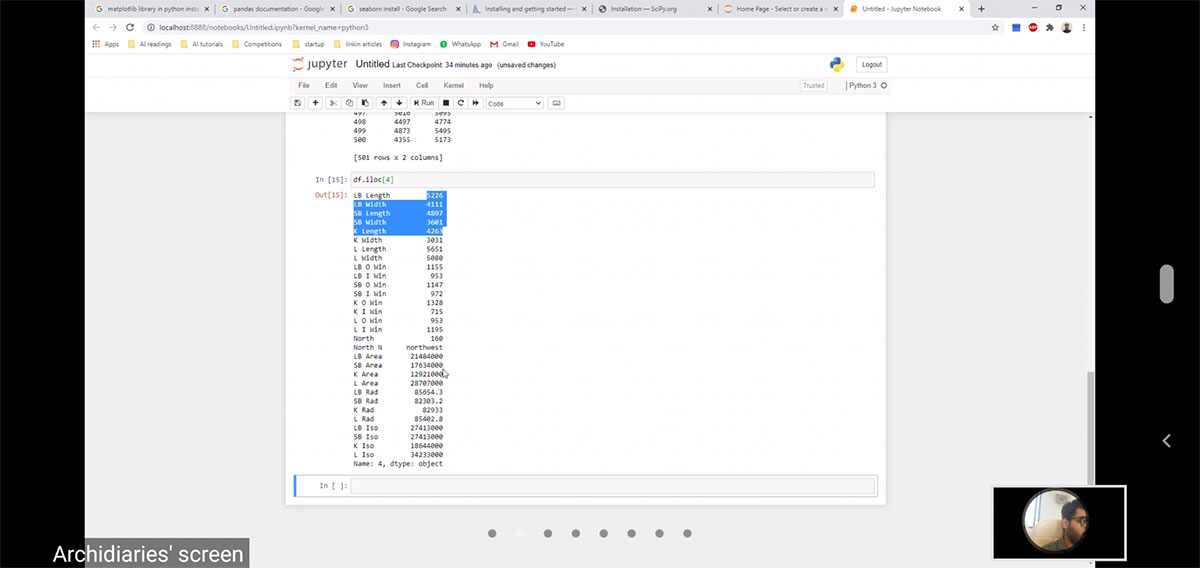
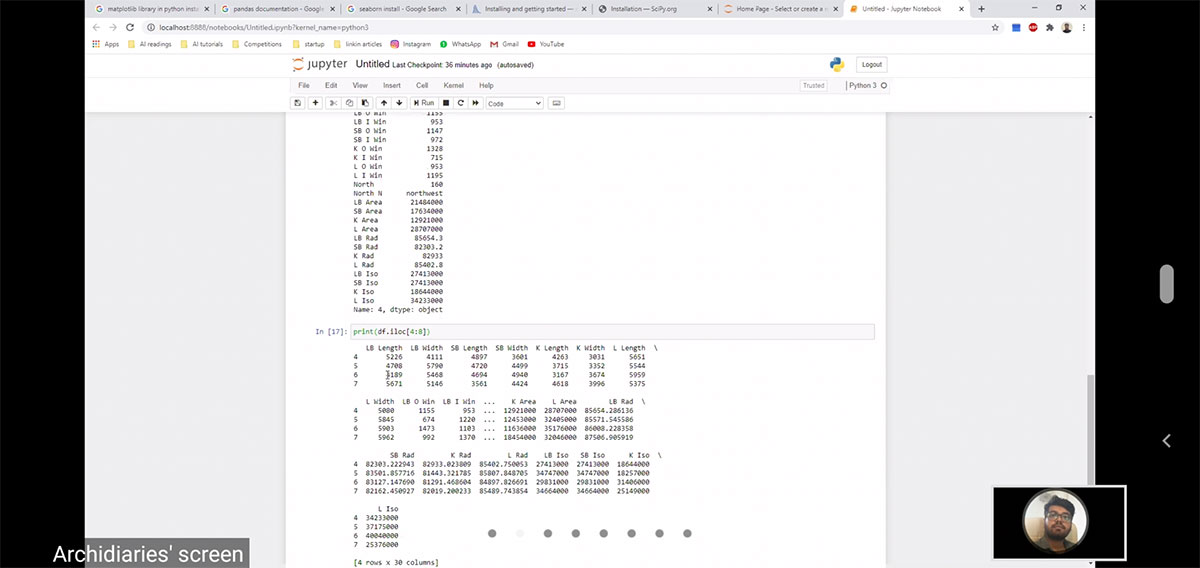
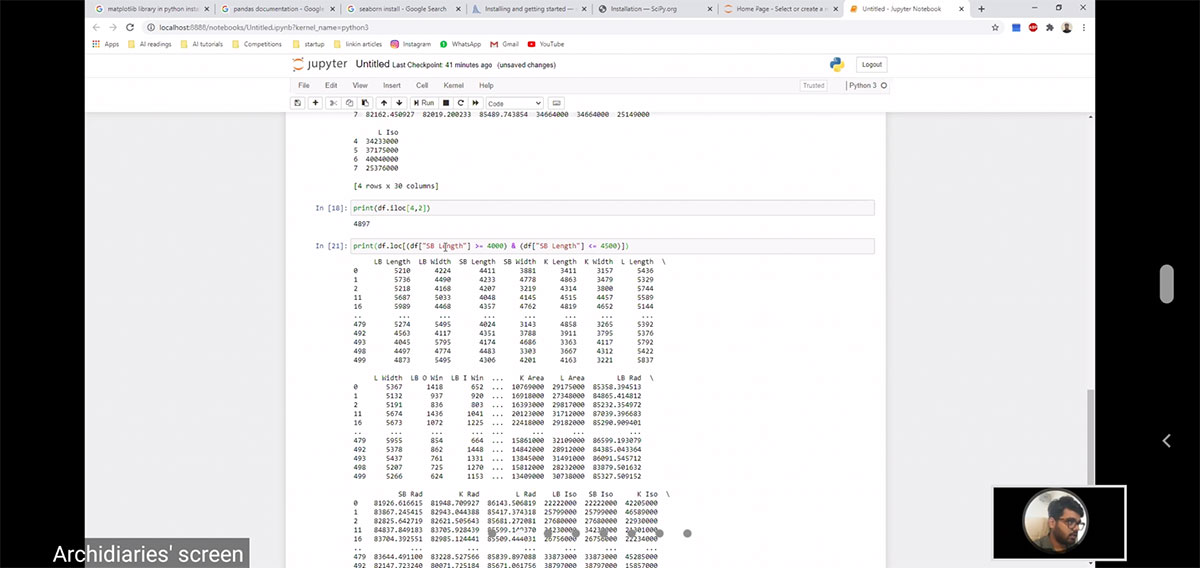
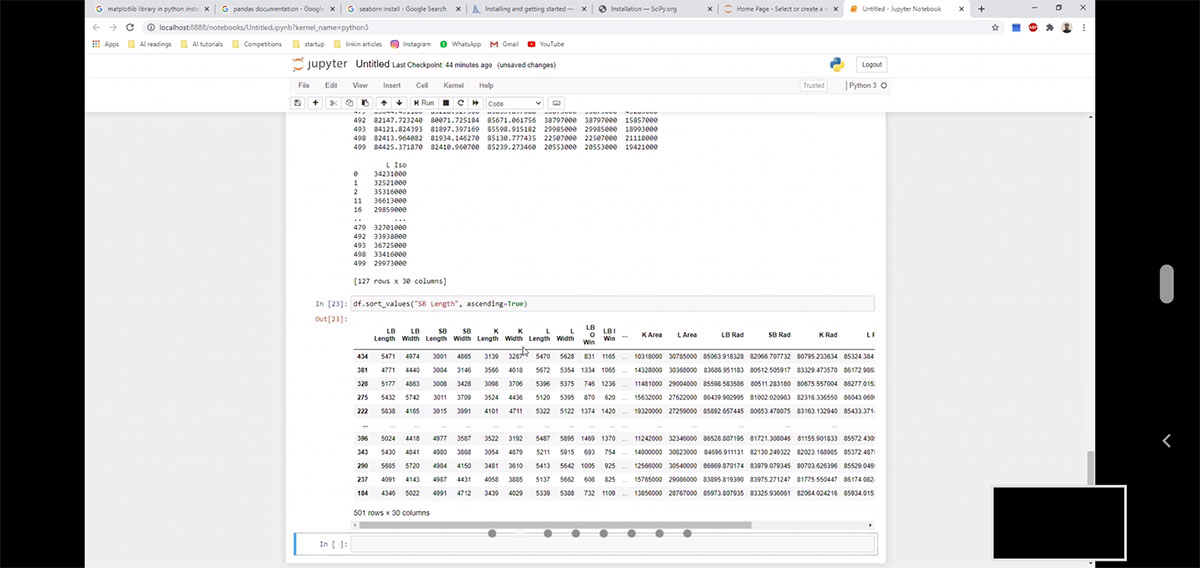
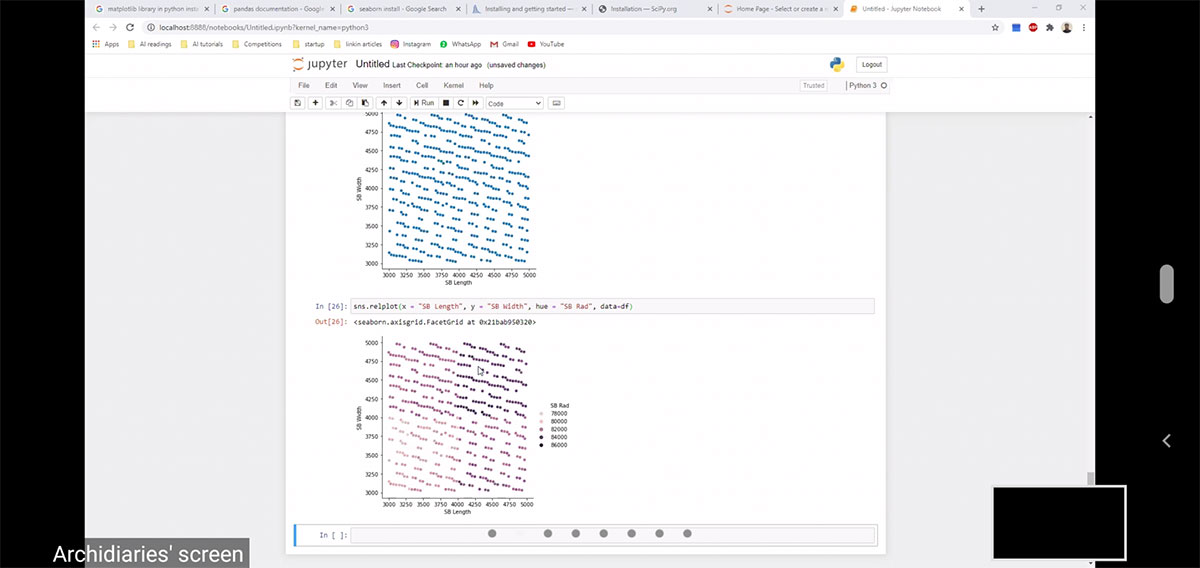
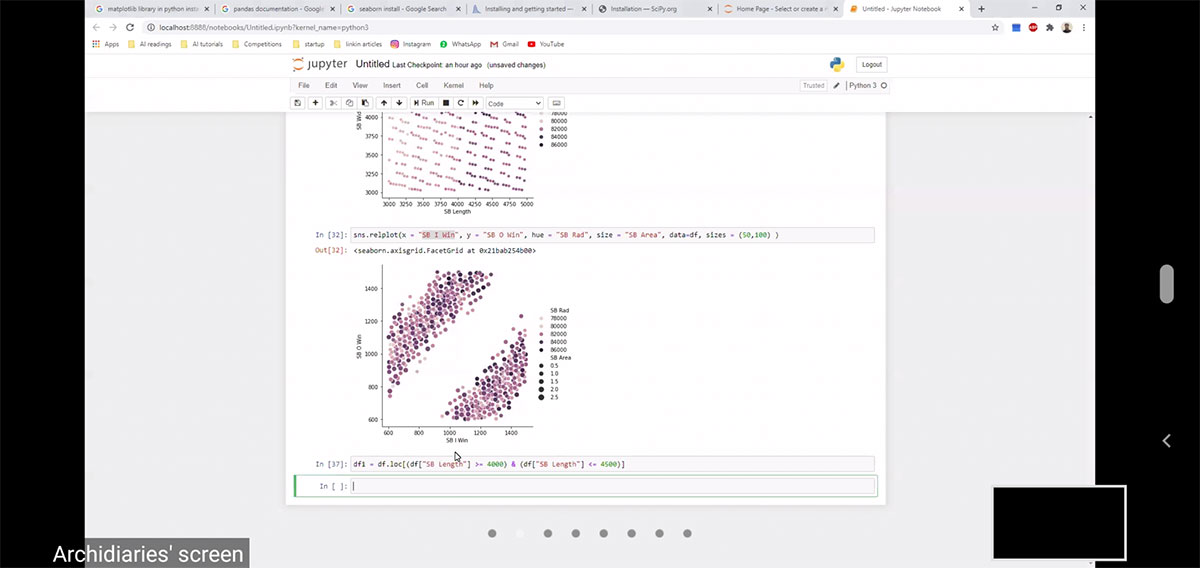
Importing Seaborn library and excel data sheet in python and generating the data on the length of rooms; Small bedroom (SB), Large bedroom (LB), Kitchen (K), Living room (L), from the excel sheet in python using pandas.Data on the length and width of LB being structured in rows and columns.Returning data frame of all the sizes of all the rooms, radiation analysis of all the rooms and iso visit value of all the openings of all the rooms.Restructuring of the data into 4 rows and 8 columns.The data being booleaned based on the objects labelled ‘[]’ and conditioned to ’>=’ and ‘<=’.Sorting booleaned data in ascending order.Relational plot of Radiation analysis of ‘SB length’ and ‘SB Width’ onto a Facetgrid.Relational plot of Radiation Analysis of ‘SB O Win’ and ‘SB I Win’ based on the area (50 to 100) of ‘SB’ on FacetGrid.Data in Excel sheet generated from grasshopper.Relational plot of radiation Analysis for all the sides of ‘SB’.Graphical representation of heat map for all the rooms.
Rajkumar Dindor is an architect graduated from Faculty of Architecture, CEPT University, India. He has been teaching as a Visiting Faculty at CEPT University since 2018 and also runs his own architecture & design practice with his partner, Prachi Nagar, at Ahmedabad.